Visualize dynophores: 2D ligand view
In this notebook, we will show how to view the dynophore’s superfeatures mapped onto a 2D view of the structure-bound ligand. This visualization uses the `rdkit library <https://www.rdkit.org/docs/index.html>`__.
[1]:
%load_ext autoreload
%autoreload 2
[2]:
from pathlib import Path

from dynophores import Dynophore
from dynophores.viz import view2d
Set paths to data files
[3]:
DATA = Path("../../dynophores/tests/data")
dyno_path = DATA / "out"
pdb_path = DATA / "in/startframe.pdb"
Load data as Dynophore object
[4]:
dynophore = Dynophore.from_dir(dyno_path)
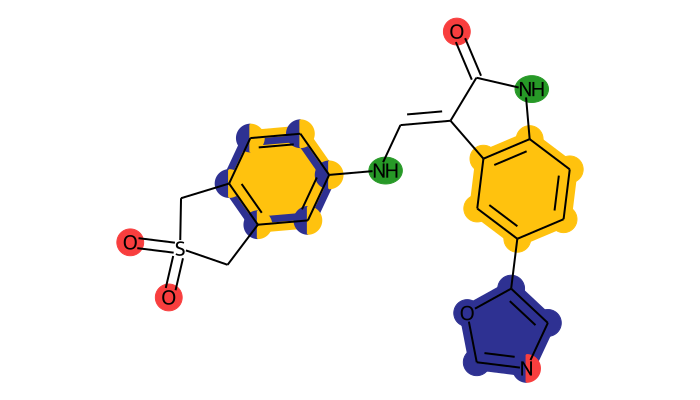
Show 2D ligand view
Static view
Note that you can toogle the superfeature highlights and PDB serial atom numbers on or off.
[5]:
view2d.static.show(dynophore, show_superfeatures=True, show_pdb_serial_numbers=False)
[5]:
Interactive view
[6]:
view2d.interactive.show(dynophore)