Dynophores
Dynamic pharmacophore modeling of molecular interactions


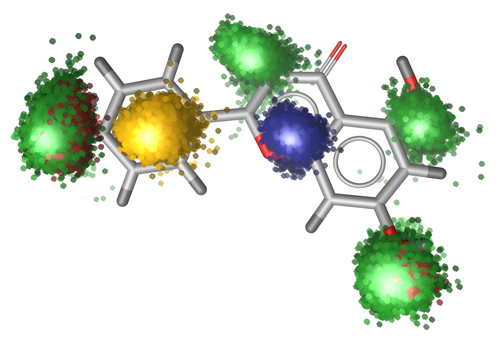
Dynophore 3D visualization.
Dynophores are an intuitive tool to explore the dynamics of molecular interactions between a macromolecule and a ligand throughout an MD simulation.
A dynophore is a collection of so-called superfeatures. A superfeature is defined as a pharmacophore feature on ligand site (defined by a feature type, e.g. HBA, and one or more ligand atom numbers/serials) that occurs at least once during an MD simulation. A superfeature can have one or more interaction partner(s) on macromolecule-side. These interaction partners are called environmental partners. Superfeatures and their environmental partners are monitored throughout an MD simulation.
This Python library offers visualization schemes for dynophore data generated with the
DynophoreApp in a single Jupyter Notebook
(template dynophore notebook).
3D view of the dynophore’s point clouds (one cloud per superfeature) using
nglviewallows easy visual inspection of the dynamic macromolecule-ligand interactions. Point clouds are rendered alongside the topology and (optionally) the trajectory underlying the dynophore. See details in this tutorial on 3D views.Statistics cover the occurrence of superfeatures and their environmental partners as well as distances between them. See details in this tutorial on plotting options.
Dynophore data can be further analyzed conveniently right there in the same notebook by working with the
Dynophoreclass. See details in this tutorial on the dynophore data structure.
User guide
Explore package
Developers