Dynophore notebook
Introduction
What is a dynophore?
A dynophore is a collection of so-called superfeatures.
A superfeature is defined as a pharmacophore feature on the ligand side — defined by a feature type and one or more ligand atoms — that occurs at least once during an MD simulation. Example: HBA[4618] (feature type, ligand atom numbers)
A superfeature has a point cloud, where each point corresponds to the centroid of feature during one frame of the trajectory.
A superfeature can have one or more interaction partner(s) on the macromolecule side. These interaction partners are called environmental partners. Example: GLN-131-A[2057] (residue name, residue number, chain, atom serial numbers).
How to work with a dynophore?
Dynophore raw data can be analyzed conveniently right here in this notebook by working with the
Dynophoreclass.Dynophore 2D view shows all superfeatures on a 2D view of the structure-bound ligand using
rdkit.Dynophore 3D view maps each superfeature’s point cloud in 3D using
nglview, allowing for an easy visual inspection of the dynamic macromolecule-ligand interactions. Point clouds are rendered alongside the complex structure’s topology and (optionally) the trajectory underlying the dynophore.Dynophore statistics cover the occurrence of superfeatures and their environmental partners as well as distances between them.
[1]:
%load_ext autoreload
%autoreload 2
Note: When you work in Jupyter notebooks, use the matplotlib Jupyter magic to enable the jupyter-matplotlib backend which makes the plots interactive.
%matplotlib widget
We do not make use of the cell magic in this documentation notebook because it seems to conflict with rendering the plots on websites.
[2]:
from pathlib import Path

import nglview as nv

# Import Dynophore class - contains all dynophore data
import dynophores as dyno
Set data paths
[3]:
DATA = Path("../../dynophores/tests/data")
dyno_path = DATA / "out"
pdb_path = DATA / "in/startframe.pdb"
dcd_path = DATA / "in/trajectory.dcd"
Note: You can set dcd_path = None in case you do not want to view the trajectory.
Load data as Dynophore object
You can load the dynophore data as Dynophore object. We will need this object below for visualization purposes but you can also use the raw data for your own customized analyses.
Note: Check out this tutorial on the dynophore’s data structure.
[4]:
dynophore = dyno.Dynophore.from_dir(dyno_path)
2D view
Investigate the dynophore’s superfeatures in 2D; display the atom serial numbers (those will show up in the superfeatures’ identifiers in the plots below).
[5]:
dyno.view2d.interactive.show(dynophore)
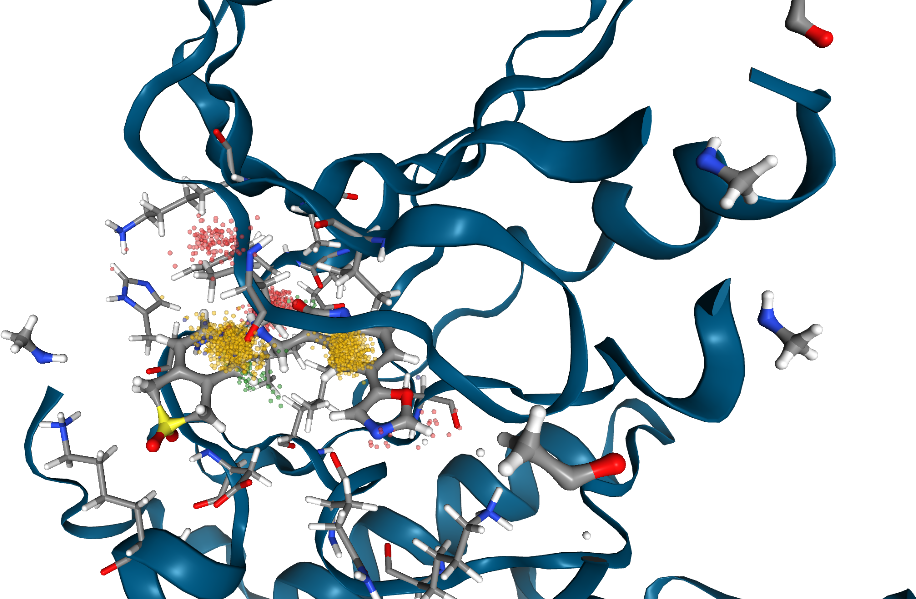
3D view
Investigate the dynophore in 3D - you have different options that you can change in the method signature below:
pdb_pathanddcd_pathhave been defined at the beginning of this notebook; these are the file paths to your complex structure’s topology and trajectory (if you do not want to load the trajectory, setdcd_path=None).visualization_type:spheresorpoints[Default] Show each frames features as small spheres with
visualization_type=spheres.[Work-In-Progress] Render the dynophore cloud as more burred and connected points using
visualization_type=points(still has some NGL rendering issues that we cannot fix on our end, see NGL GitHub issue)
color_cloud_by_frame:FalseorTrue[Default] Color cloud by superfeature type. Example: The points belonging to a HBA-based superfeature will all be colored red.
Color cloud by superfeature type and frame index. Example: The points belonging to a HBA-based superfeauture will be colored from red (first frame) to light red (last frame).
macromolecule_color: Set a color for the macromolecule; defaults to blue.frame_range: Show a selected frame range only, e.g.frame_range=[100, 1000]. By default, all frames are shown withframe_range=None.
Interact directly with the 3D visualization using the NGL GUI:
Toogle on/off macromolecule > cartoon
Toogle on/off ligand > hyperball
Toogle on/off pocket residue side chains > licorice
Toogle on/off superfeatures > superfeature identifier e.g. HBA[4618]
Run trajectory if loaded
[6]:
view = dyno.view3d.show(
    dynophore,
    pdb_path=pdb_path,
    dcd_path=dcd_path,
    visualization_type="spheres",
    color_cloud_by_frame=False,
    macromolecule_color="#005780",
    frame_range=None,
)
view.display(gui=True, style="ngl")
[7]:
view.render_image(trim=True, factor=2, transparent=True);
[8]:
view._display_image()
[8]:
In case a trajectory is loaded, use the TrajectoryPlayer for more visualization options:
[9]:
nv.player.TrajectoryPlayer(view)
Statistics
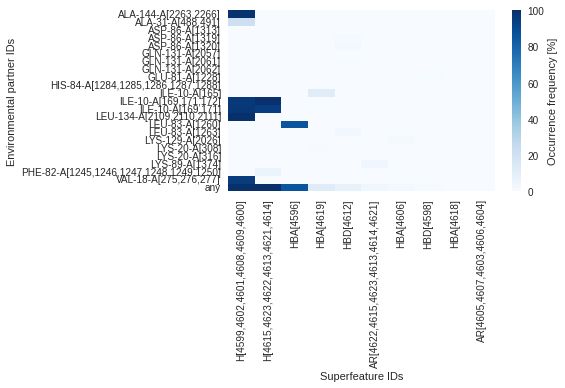
Plot interactions overview (heatmap)
Check how often each superfeature interacts with which environmental partners throughout the MD simulation (in %).
[10]:
dyno.plot.interactive.superfeatures_vs_envpartners(dynophore)
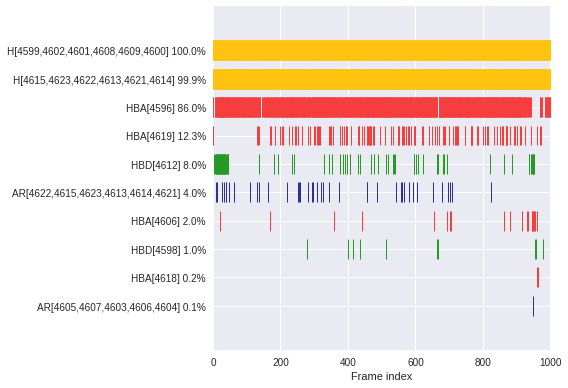
Plot superfeature occurrences (time series)
Check when (barcode) and how often (in %) a superfeature \(S\) occurs throughout the MD simulation.
\(S\,\text{occurrence [%]} = \frac{\text{Number of frames in which}\,S\,\text{occurs}}{\text{Number of frames}} \times 100\)
[11]:
dyno.plot.interactive.superfeatures_occurrences(dynophore)
Plot interactions for example superfeature (time series)
Interaction occurrence
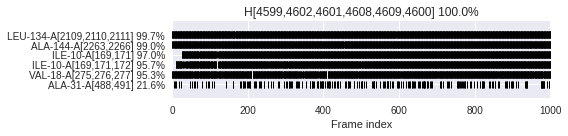
Check when (barcode) and how often (in %) each environmental partner \(E\) interacts in context of a superfeature \(S\) (\(E_S\)).
\(E_S\,\text{occurrence [%]} = \frac{\text{Number of frames where}\,E\,\text{interacts in context of}\,S}{\text{Number of frames where}\,S\,\text{occurs}} \times 100\)
[12]:
dyno.plot.interactive.envpartners_occurrences(dynophore)
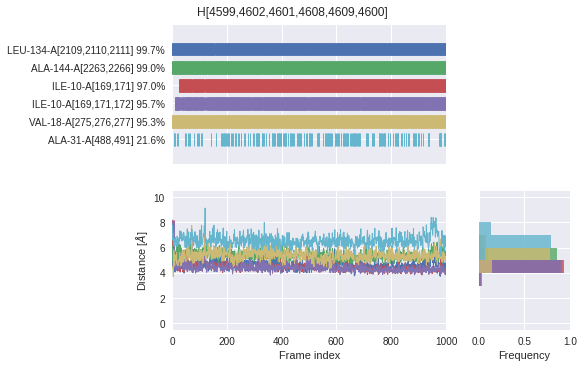
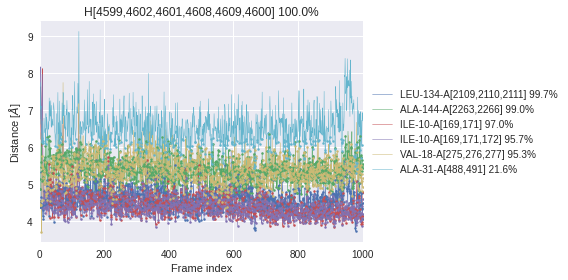
Interaction distances
Check for each superfeature, the distances to all environmental partners throughout the MD simulation.
Time series: Distances are shown for all frames regardless of whether that frame shows an interaction between the environmental partner and the superfeature’s ligand atoms or not. Interactions are indicated with a dot in the plot.
Histogram: Only distances are shown that belong to frames in which an interaction between the environmental partner and the superfeature’s ligand atoms ocurrs.
[13]:
dyno.plot.interactive.envpartners_distances(dynophore)
Interaction profile (all-in-one)
This is a summary of the plots shown above. Note that in this case all distances throughout the MD simulation are shown (regardless of whether the frame shows an interaction or not).
[14]:
dyno.plot.interactive.envpartners_all_in_one(dynophore)